Fall Prevention Cost-Benefit Model Data
Reference data for cost-benefit calculations in the government policy brief.

Reference data for cost-benefit calculations in the government policy brief.
1. Fall Incidence (Community-Dwelling 65+)
| Age Group | Annual Fall Rate | Source | | --- | --- | --- | | 65+ (all) | 30–32% | Frontiers in Public Health 2024 | | 65–69 | 25.0% | " | | 70–79 | 34.6% | " | | 80+ | 40.5% | " |
Approximately 10% of 65+ experience multiple falls per year.
2. Injury Rates From Falls
| Outcome | Rate | Source | | --- | --- | --- | | Falls requiring medical attention | 30% of all falls | BJSM 2022 | | Falls resulting in injury (injurious fall) | 35% | Residential aged care data | | ED presentations → hospital admission | 42.7% | RACGP | | Falls involving fractures (hospitalised) | 50% | AIHW |
Hospital stays:
- Acute care: 14.4 days (men), 13.7 days (women)
- Rehabilitation (if needed): 35.6 days (men), 30.1 days (women)
- 9.5% become first-time aged care residents post-fall
3. Cost Per Fall (Australian Data)
| Type | Cost | Notes | | --- | --- | --- | | ED presentation (non-admitted) | $380–$1,870 | 2006 NSW / more recent | | Hospitalised faller (acute care) | $8,959–$9,347 | SD $6,638 – BJSM | | 30-day cost following admission | $9,068 mean | Median $6,524 – BJSM | | All falls (all types, 30-day) | $3,779 mean | Range $623–$9,068 – BJSM | | Residential aged care (injurious) | $2,494 | For comparison only |

Use $3,779 as the defensible mean cost per medically-attended fall for community-dwelling seniors.
4. Risk Reduction From Balance-Based Exercise
| Program | Fall Risk Reduction | Source | | --- | --- | --- | | Group-based interventions (China) | 64% | PMC 2023 | | Australian trial (exercise + health ed) | 43% | Peer-reviewed | | Balance/strength training | 40–42% | Multiple RCTs | | Otago Exercise Program (65+) | 35–40% (39–46%) | PMC ROI analysis | | Otago (80+) | Higher | " | | Tai Chi: Moving for Better Balance | 48–55% | " | | Stepping On | 31% | Peer-reviewed | | Brief interventions (10 weeks) | 30% | SBST program |
Conservative estimate for modelling: 40% (lower bound of group exercise range).
5. Return on Investment
| Program | Age Group | ROI | Notes | | --- | --- | --- | --- | | Otago Exercise Program | 65+ | 36% | Net benefit $121.85/participant – PMC | | Otago Exercise Program | 80+ | 127% | Highest for older adults – PMC | | Tai Chi: Moving for Better Balance | 65+ | 46% | PMC | | Tai Chi: Moving for Better Balance | 80+ | 509% | Highest of all programs – PMC | | Stepping On | All | 64% | PMC |
OEP cost per participant: $339.15 (6-month program)
Key insight: These programs require trained instructors and time-limited funding. Croquet clubs are volunteer-run and self-sustaining after infrastructure investment—potentially higher long-term ROI.
6. Worked Example: Queensland Croquet Players
Population: 1,500 croquet players aged 65+ in Queensland
Baseline (No Intervention)
| Step | Calculation | Result | | --- | --- | --- | | Falls per year | 1,500 × 32% | 480 falls | | Requiring medical attention | 480 × 30% | 144 falls | | Healthcare cost | 144 × $3,779 | $544,000/year |
With 40% Risk Reduction (Conservative)
| Step | Calculation | Result | | --- | --- | --- | | Falls per year | 480 × 0.60 | 288 falls | | Requiring medical attention | 288 × 30% | 86 falls | | Healthcare cost | 86 × $3,779 | $325,000/year |
Annual Saving
~$219,000 in avoided healthcare costs across Queensland's croquet-playing seniors.
Over 10 years (assuming membership remains stable): $2.19 million in healthcare savings.
7. Data Limitations
- No croquet-specific fall prevention data — uses general lawn sports / balance exercise literature
- Most Australian cost data from residential aged care or UK origins
- Long-term adherence costs not fully quantified
- Indirect costs (carer burden, social care) variably captured
Sources
Fall Incidence & Rates
Cost Data
Risk Reduction Evidence
- CDC Morbidity and Mortality Weekly Report, November 2023
Australian Context
Queensland Data
Document prepared: February 2026
Data current to: 2024–2025 published research

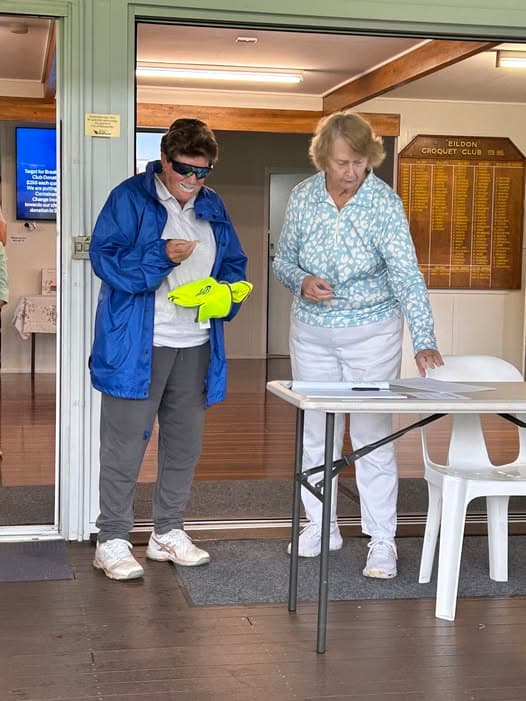
Eildon club member Desley Bischoff becomes official GC referee
Desley Bischoff has been appointed as an official Australian GC referee. She received her vest and badge at a recent clu…
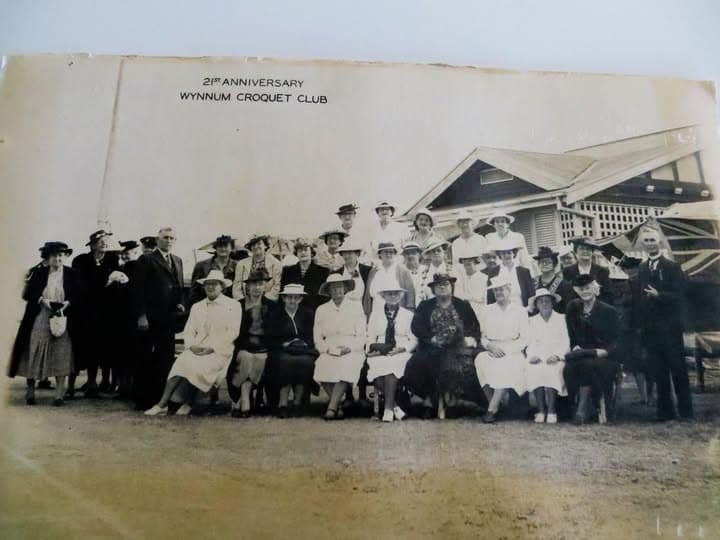
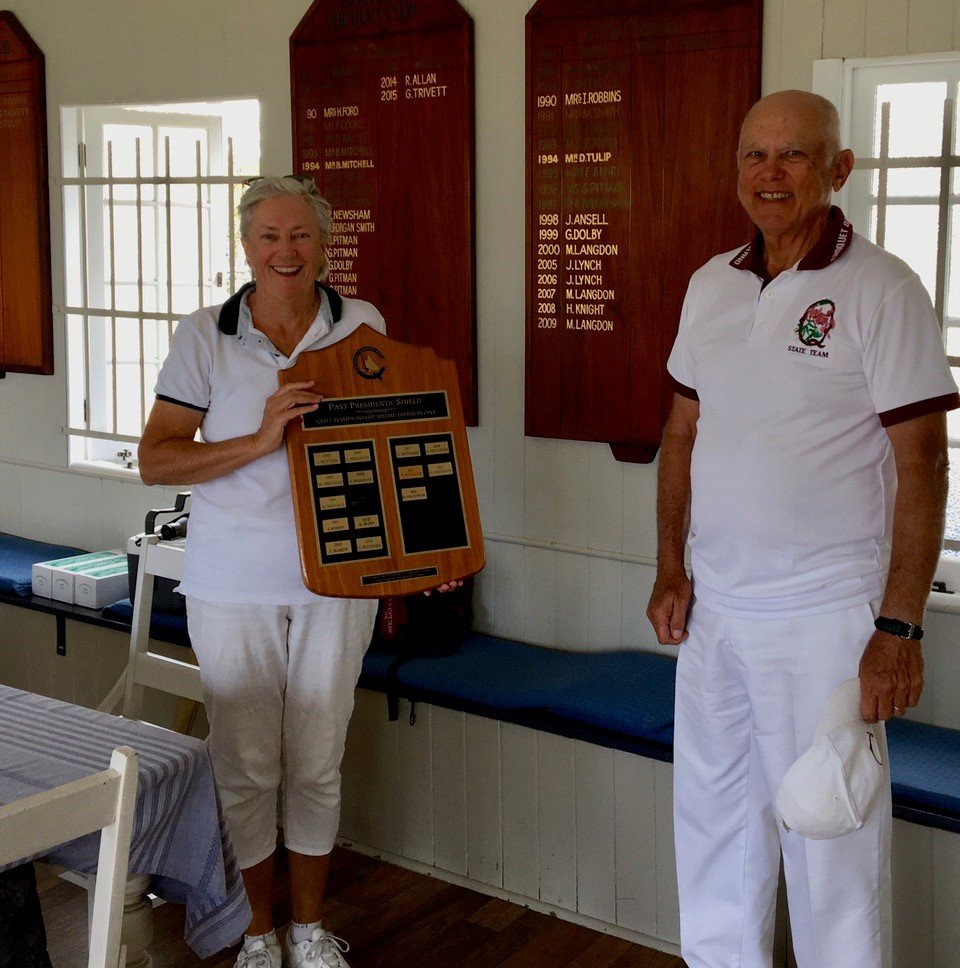
Wynnum Croquet Club celebrates 21 years
An anniversary photograph captures the Wynnum Croquet Club's growth over 21 years, showing a thriving club that maintain…

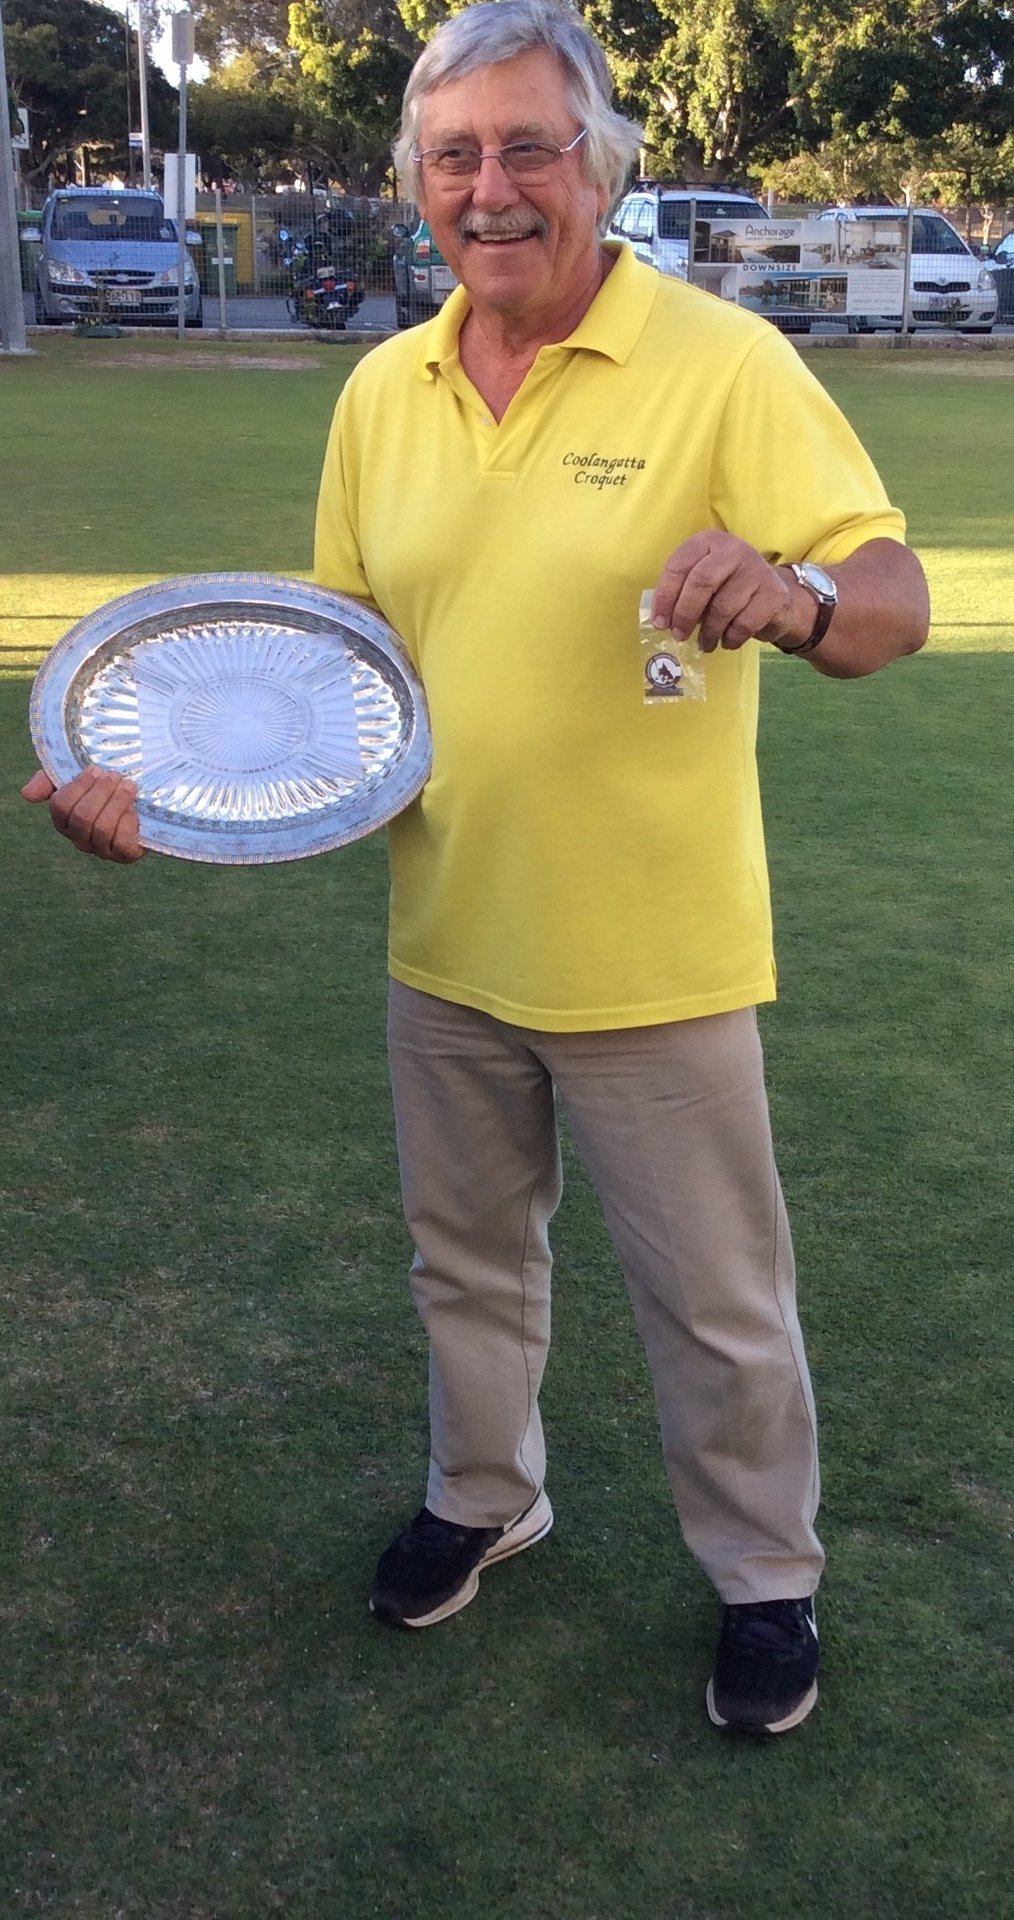
The three croquet balls: Dawson, Invictus, and Sunshiny
There are exactly three croquet balls approved for tournament play anywhere in the world. Two of them are made in Austra…